- Smart Options Trader
- Posts
- Alphabet Just Avoided a Bearish Signal
Alphabet Just Avoided a Bearish Signal
A near-miss in GOOG’s chart could keep the bullish trend alive.
Simon Berry & Andrew Hecht
March 10, 2026
In partnership with
👀 New Updates on Tradier Pro
New Buy/Sell Column
You can now enable a dedicated Buy/Sell (BS) column directly inside the Options Grid.
Improved Staged Orders
We’ve improved staged orders to help you track ideas before execution.
Live & Paper Trading Toggle
Switch between live and paper accounts instantly within the same login, no separate sessions required.
Frustrated with high fees or clunky tools?
Tradier Pro offers advanced options trading, spread strategies, real-time insights, and built-in risk tools.
🕒 Market Overview: The bottom long leg of the GOOG vertical bull call spread is below the technical resistance level, making it an attractive spread from a risk-reward perspective at over 1:2. The December 18, 2026, $330-$370 vertical bull call spread at $12 has an attractive risk-reward profile.
📈 Sector Insight: Technology stocks have been under pressure, and as GOOG is one of the leading stocks in the sector, an overall selloff could propel the shares lower. However, GOOG avoided the bearish formation in the stock. Moreover, the negative sentiment for the tech sector could lead to a substantial recovery. The $330-$370 call spread for December 2026 expiration has an attractive risk-reward profile, making it a compelling opportunity.
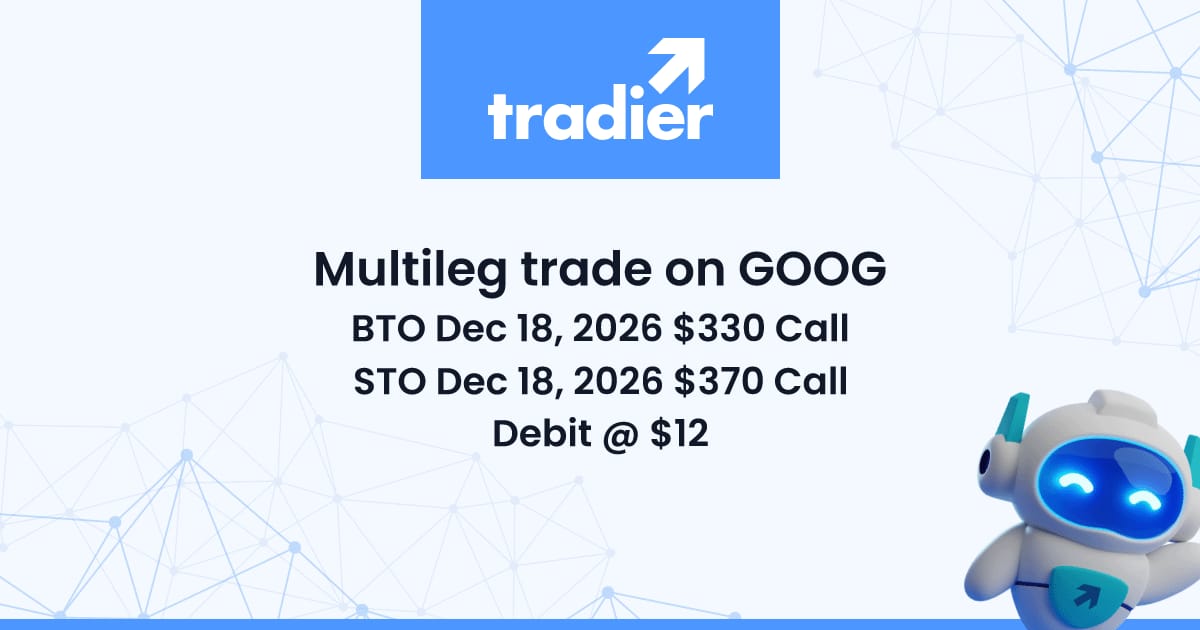
💡 Today's Trade Idea: Vertical Bull Call Spread on GOOG.
SMART TRADE IDEA 💡
Vertical Bull Call Spread on GOOG
Trade Setup: Buy $330 Call Option, Sell $370 Call Option with December 18, 2026 expiration.
Cost: $12.00 or lower ($1,200 per spread)
Max Profit: $28 ($2,800 per spread)
Breakeven: $342 on GOOG on December 18, 2026
Risk-reward: 1:2.33
Management Plan: Take profits or roll if GOOG shares reach $350 per share or higher before December 18, 2026.

NOTE: Remember, options trading involves substantial risk and is not suitable for all investors. Consider your investment objectives, financial resources, and experience level before implementing this or any options strategy.
DISCLOSURE: Trade recommendations may have changed since publication. Evaluate current market prices and risk/reward before acting. Trading involves significant risk and is not suitable for everyone. This is not personalized investment advice. Past performance doesn't guarantee future results. Publisher and contributors may hold positions in recommended securities. Readers assume full responsibility for their trading decisions. Consult a financial professional before investing.
 | Andy Hecht | Smart AnalysisA Wall Street veteran and analyst covering technical and fundamental factors in markets across all asset classes for over four decades. |

GOOG’s Chart Just Dodged a Major Technical Warning
Alphabet remains one of the dominant forces in global technology, driven by leadership in artificial intelligence, cloud computing, and digital advertising. The company’s AI initiatives—from its Gemini models to continued investments in data infrastructure—have helped reinforce its position among the world’s most valuable companies. As investors closely monitor the AI arms race among major tech firms, Alphabet’s stock has continued to attract strong institutional interest.
Even with powerful fundamentals, technical patterns often play a key role in shaping short-term price movements in large-cap technology stocks. In February 2026, Alphabet shares came very close to forming a classic bearish key-reversal pattern on the monthly chart—a signal that has historically preceded deeper corrections in many assets. However, the pattern narrowly failed to trigger, leaving open the possibility that the longer-term bullish trend remains intact.
Alphabet, the company formerly known as Google, has the third-leading market cap, behind only NVIDIA and Apple. At $3.62 trillion, GOOG’s value is nearly $560 billion more than fourth-place Microsoft.
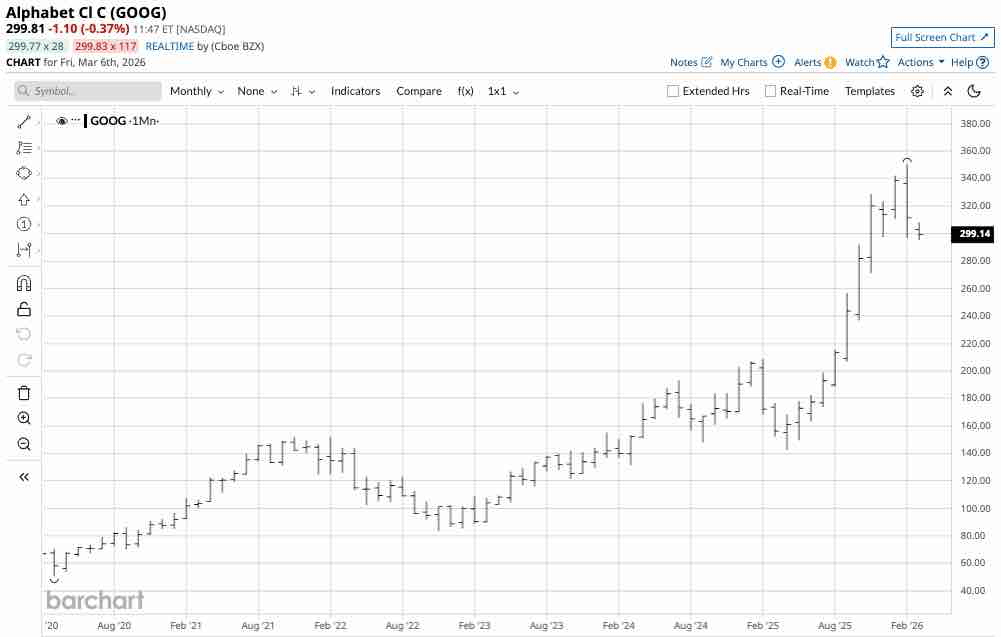
Source: Barchart
The monthly chart highlights the ascent of GOOG shares and the rally that propelled them to a record high of $350.15 high in February 2026.
A bearish key reversal pattern occurs when the price of a stock or asset rises above the previous period’s high and closes below the previous period’s low. The monthly GOOG chart shows the stock barely avoided a bearish key reversal in the shares in February 2026. GOOG reached a new record high and closed below January’s low, which could mean a far deeper correction is on the horizon. In January 2026, GOOG’s trading range was from $310.65 to $342.29 per share. In February, GOOG reached a new high of $350.15 and settled around $311.43 per share, making a higher high and just avoiding closing below the January low, which would have set up the bearish key reversal pattern. If this bearish scenario played out, it would often lead to further losses. GOOG’s first technical support level is at the February 2025 high of $208.780 per share, over $90 below the current price.
Meanwhile, GOOG’s late session recovery and lower prices in early March could be an opportunity, as technical resistance is at the recent $350.15 high.
The December 18, 2026, $330-$370 vertical bull call spread at $12 has an attractive risk-reward profile.
AD - TRADE SMARTER WITH TRADIER
A Brokerage Built for Options Traders
Tradier offers fast execution, direct API access, and seamless platform integrations—all with a flat-rate subscription model that eliminates per-contract commissions. Trade on your terms with a brokerage designed for serious traders.

When it all clicks.

Why does business news feel like it’s written for people who already get it?
Morning Brew changes that.
It’s a free newsletter that breaks down what’s going on in business, finance, and tech — clearly, quickly, and with enough personality to keep things interesting. The result? You don’t just skim headlines. You actually understand what’s going on.
Try it yourself and join over 4 million professionals reading daily.