- Smart Options Trader
- Posts
- Europe and Asia Are Scrambling for LNG — Here are the Trades
Europe and Asia Are Scrambling for LNG — Here are the Trades
Rising LNG demand could tighten U.S. supplies and push natural gas prices higher.
Simon Berry & Andrew Hecht
April 02, 2026

This Week we have 2 Trade Ideas for your consideration! 👀
Trade 1
🕒 Market Overview: If LNG demand from the U.S. begins to soar and inventories do not build rapidly through the injection season from March through November, U.S. natural gas prices could rise. Moreover, a hot summer season, which increases air-conditioning demand, could put even more upside pressure on U.S. natural gas prices.
📈 Sector Insight: The January 2027 $12-$20 vertical bull call spread on the UNG ETF has an attractive risk-reward profile at over 1:3 at current prices.
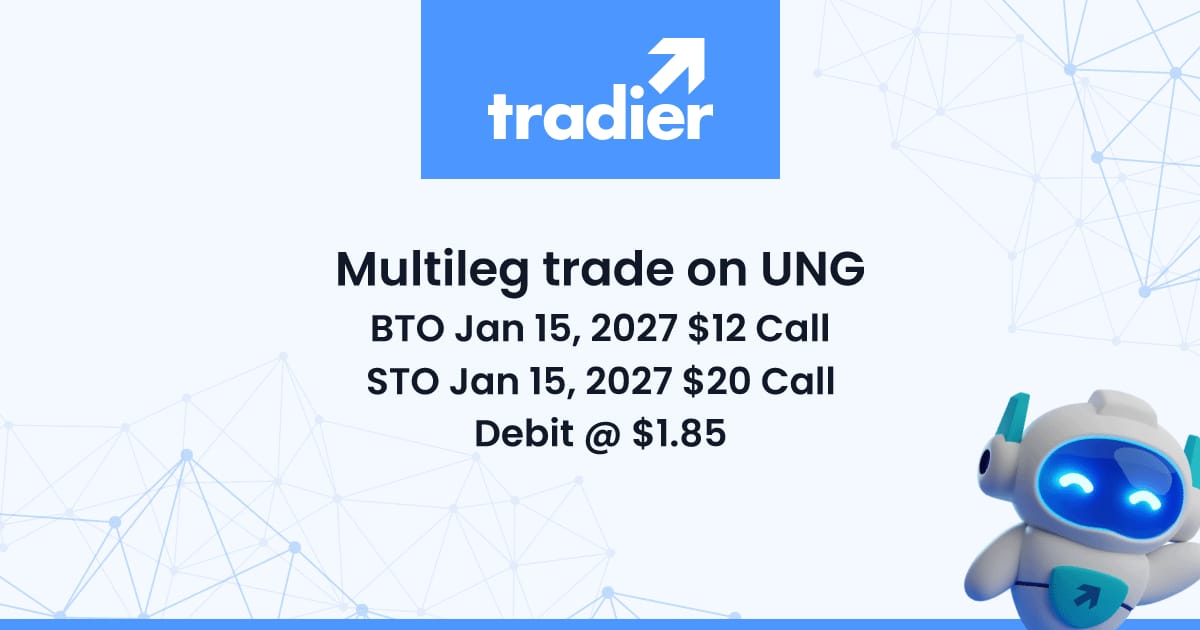
💡 Today's Trade Idea: Bull Call Spread on UNG.
SMART TRADE IDEA 💡
Bull Call Spread on UNG
Trade Setup: Buy $12 Call / Sell $20 Call, January 15, 2027, expiration.
Cost: $1.85 ($185 per spread)
Max Profit: $6.15 ($615 per spread)
Breakeven: $13.85 on UNG on January 15, 2027
Risk-reward: 1:3.3
Management Plan: Take profits or roll up if UNG reaches $20 before January 15, 2027.

Need a Tradier Account to execute this trade?
NOTE: Remember, options trading involves substantial risk and is not suitable for all investors. Consider your investment objectives, financial resources, and experience level before implementing this or any options strategy.
DISCLOSURE: Trade recommendations may have changed since publication. Evaluate current market prices and risk/reward before acting. Trading involves significant risk and is not suitable for everyone. This is not personalized investment advice. Past performance doesn't guarantee future results. Publisher and contributors may hold positions in recommended securities. Readers assume full responsibility for their trading decisions. Consult a financial professional before investing.
Trade 2
🕒 Market Overview: If LNG demand from the U.S. begins to soar and inventories do not build rapidly through the injection season from March through November, U.S. natural gas prices could rise. Moreover, a hot summer season, which increases air-conditioning demand, could put even more upside pressure on U.S. natural gas prices.
📈 Sector Insight: LNG, the top U.S. LNG producer, has a low P/E ratio and remains in a bullish trend, making the $320-$400 call spread for January 15, 2027, expiration attractive at a 1:2.63 risk-reward ratio.
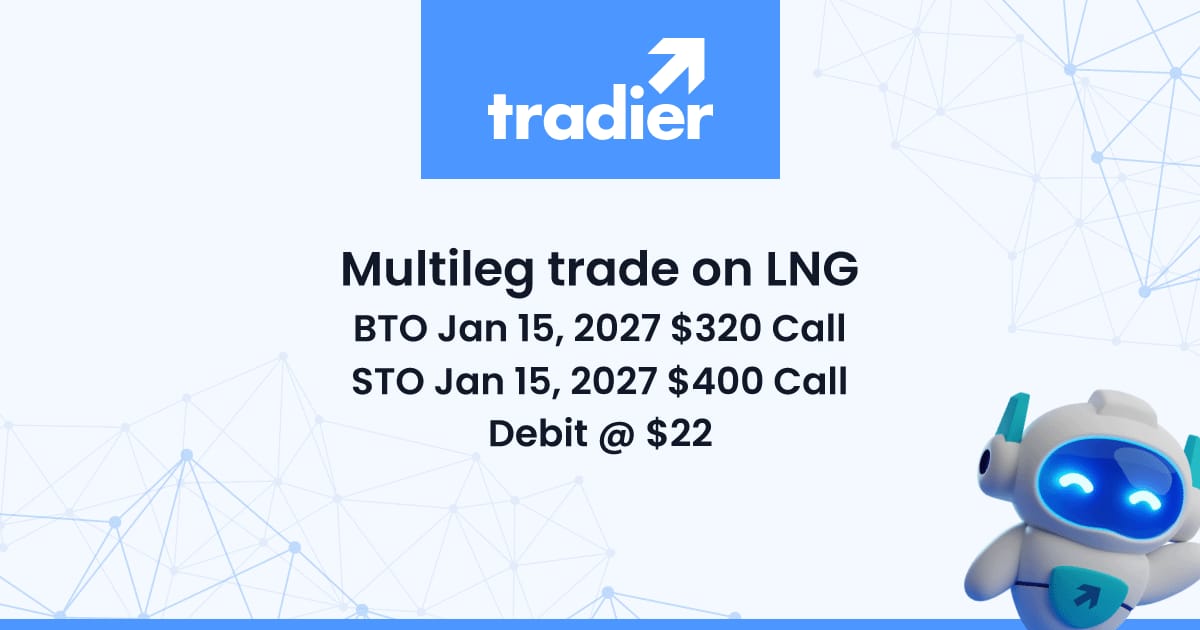
💡 Today's Trade Idea: Bull Call Spread on LNG.
SMART TRADE IDEA 💡
Bull Call Spread on LNG
Trade Setup: Buy $320 Call / Sell $400 Call, January 15, 2027, expiration.
Cost: $22.00 ($2,200 per spread)
Max Profit: $58.00 ($5,800 per spread)
Breakeven: $342.00 on LNG on January 15, 2027
Risk-reward: 1:2.63
Management Plan: Take profits or roll up if LNG reaches $390 before January 15, 2027.

Need a Tradier Account to execute this trade?
NOTE: Remember, options trading involves substantial risk and is not suitable for all investors. Consider your investment objectives, financial resources, and experience level before implementing this or any options strategy.
DISCLOSURE: Trade recommendations may have changed since publication. Evaluate current market prices and risk/reward before acting. Trading involves significant risk and is not suitable for everyone. This is not personalized investment advice. Past performance doesn't guarantee future results. Publisher and contributors may hold positions in recommended securities. Readers assume full responsibility for their trading decisions. Consult a financial professional before investing.
 | Andy Hecht | Smart AnalysisA Wall Street veteran and analyst covering technical and fundamental factors in markets across all asset classes for over four decades. |

LNG Demand Is Surging — and These Trades Could Benefit
In 1990, when the NMEX’s NYMEX division introduced futures and options contracts on U.S. natural gas, the energy commodity’s addressable market was limited to the pipeline network. Over the past decades, technological advances have enabled processing the gas into liquid, or LNG, for worldwide transportation on ocean tankers to regions where prices are considerably higher.
The world’s leading natural gas-producing countries are as follows:

Source: worldometers.info
The chart shows that while the U.S. leads the world in natural gas production, Russia ranks second, with around 2.5 times the production of third-place Iran. Western Europe had depended on the Russian pipeline network for its natural gas requirements. However, the war in Ukraine and NATO sanctions changed the equation, driving European natural gas futures prices higher.
Meanwhile, the war in Iran that has caused uncertainty over the Strait of Hormuz, the critical chokepoint for energy shipping, and retaliatory regional attacks on countries in the Middle East, has caused rising supply concerns. As the chart shows, Iran, Qatar, Saudi Arabia, and the UAE together produce over 22.5 MMcf, nearly as much as second-place Russia.
Natural gas is in the crosshairs of the war in the Middle East. As one of the most volatile energy commodities, natural gas prices could soar over the coming months as the U.S. increases exports to offset global shortages.
European prices have begun to rise

Source: Barchart
The continuous contract chart of U.K. natural gas futures shows that they reached all-time highs in 2022, when Russia invaded Ukraine, amid supply concerns triggered by sanctions on Russia and fears of natural gas shortages in the United Kingdom. The war in the Middle East and Iranian attacks on neighboring countries’ oil and gas production and processing have caused U.K futures prices to rise above their technical resistance levels.

Source: Barchart
The continuous contract chart of Dutch natural gas futures shows that they also reached all-time highs in 2022, amid Russia's invasion of Ukraine, supply concerns, sanctions on Russia, and fears of natural gas shortages in the Netherlands and across European NATO countries. The war in the Middle East and Iranian attacks on neighboring countries’ oil and gas production and processing have pushed Dutch futures prices above their technical resistance levels.
The war is impacting LNG shipments to Asia
Attacks on Qatari natural gas production and the blockage of the Strait of Hormuz have driven Asian LNG prices higher. As Asia turns to other suppliers, LNG shipments from the Atlantic and Pacific basins will likely increase.
The bottom line is that the wars in Ukraine and the Middle East are causing Europe and Asia to secure LNG requirements from other regions.
The U.S. is the leading producer, which could weigh on inventories as global demand rises
The countries with the largest LNG export capacity as of September 2025 were:
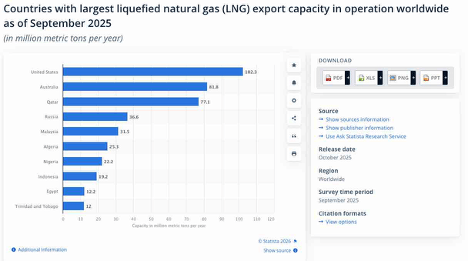
Source: Statista
The chart shows that the United States has the leading LNG export capacity, followed by Australia. Meanwhile, the wars are impacting third-place Qatar, and sanctions are a significant factor for fourth-place Russia.
In the U.S., the 2025/2026 peak natural gas season is coming to an end.
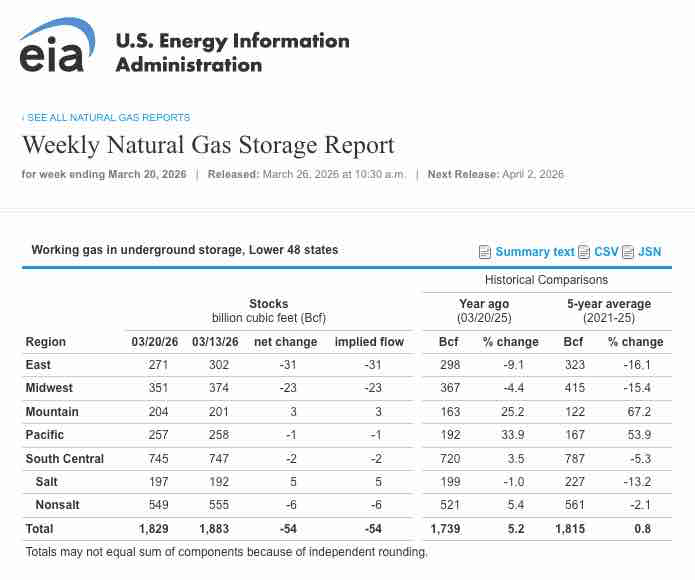
Source: EIA
As the chart shows, natural gas in storage across the United States received its first injection of 35 billion cubic feet for the week ending March 13, 2026. Before another withdrawal of 54 bcf during the week of March 20. Stocks fell to 1.829 trillion cubic feet at the latest low, likely the low for the 2025/2026 withdrawal season, as forecasts are currently for an injection for the week ending on March 27. Inventories ended the season above last year’s low of 1.698 tcf, but were below the previous year’s end-of-season level at 2.259 tcf. As of March 20, U.S. inventories were 5.2% above the previous year, and 0.8% over the five-year average for late-March. However, booming demand from Europe and Asia due to damage to Middle Eastern natural gas and LNG infrastructure, and ongoing sanctions on Russia, could cause stocks to rebuild slowly during the 2026 U.S. injection season as LNG shipments head to areas where prices are soaring.
UNG is the unleveraged U.S. natural gas ETF
The United States Natural Gas Fund (UNG) is an unleveraged ETF that tracks U.S. natural gas futures prices. At $12.18 per share, UNG had nearly $359.35 million in assets under management. UNG trades an average of over 13.575 million shares per day and charges a 1.24% management fee.
Natural gas is a highly volatile energy commodity, and the price action in the UNG ETF reflects its price variance.
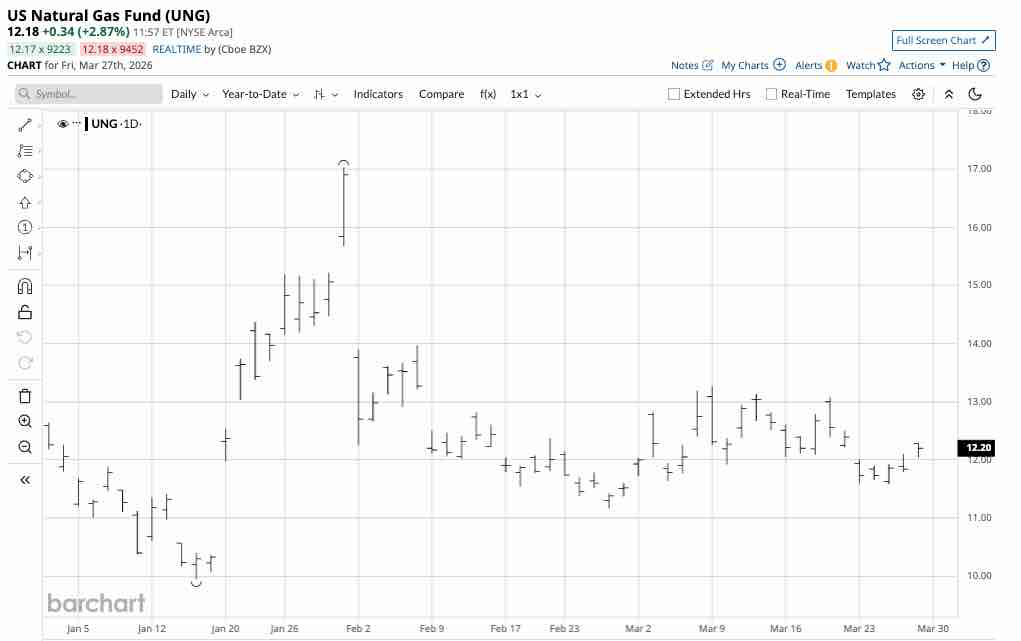
Source: Barchart
As the daily chart shows, UNG has traded between $9.95 and $17.02 in 2026. At $12.18 per share in late March, UNG is closer to the 2026 low than the high.
If LNG demand from the U.S. begins to soar and inventories do not build rapidly through the injection season from March through November, U.S. natural gas prices could rise. Moreover, a hot summer season, which increases air-conditioning demand, could put even more upside pressure on U.S. natural gas prices. Meanwhile, natural gas futures for January 2027 delivery reflect the energy commodity’s seasonal nature and are trading over $2 per MMBtu above the price for May 2026 delivery.
——————————————————————————————————————-
Alternatively, Cheniere Energy, the top U.S. LNG producer, has been in a bullish trend since the March 2020 pandemic-inspired low.

Source: Barchart
The chart shows an over tenfold rally from the March 2020 low of $27.06 to the most recent March 2026 high of $299.49. At over $298 per share, LNG had a market cap of approximately $61.25 billion. LNG is a highly liquid stock that trades an average of over 4.22 million shares daily. The $2.22 annual dividend yields 0.74%. LNG’s P/E ratio at 17.25 is substantially lower than the SPY’s at 24.43. LNG is a company that stands to benefit from increased U.S. LNG demand.
AD - TRADE SMARTER WITH TRADIER
A Brokerage Built for Options Traders
Tradier offers fast execution, direct API access, and seamless platform integrations—all with a flat-rate subscription model that eliminates per-contract commissions. Trade on your terms with a brokerage designed for serious traders.
